The Otovo Solar Insight: Solar Payback Trends 2019
Thanks to falling solar panel prices and increased CO2 cost for dirty fuels, payback times for solar power for consumers was way down in Europe in 2018.
Payback times are the layman's way of translating the economics of solar energy into something practicable. By dividing the full cost of the solar panels by their yearly output in energy multiplied by the cost of electricity, one finds the number of years needed to pay back the cost of the system.
This report analyzes eight European markets based on their solar resources (1), electricity prices (2), subsidies, taxes and feed-in tariff regimes (3). For some countries, future policy changes are communicated such as e.g. in the United Kingdom where solar projects installed from April 2019 will be subject to revised and less attractive conditions. This analysis however, is based on the current subsidy conditions, reflecting the variations between countries as it is today.
Subsidies, taxes and feed-in tariff regimes, based on a 2.9 kWp residential project (3):
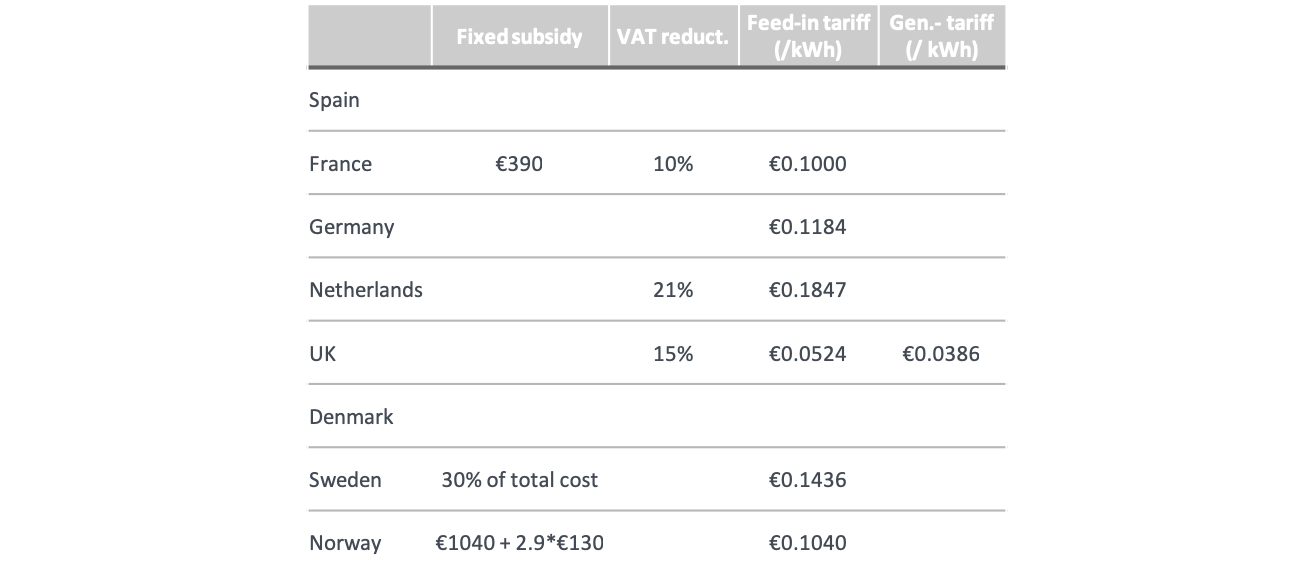
For simplicity, the cost of systems are kept equal in all countries, at €1800 per kWp (incl. VAT, pre subsidies). This cost represent the total cost associated with installing a residential solar PV system, including engineering, hardware (panels, inverter, mounting materials), mounting and electrical work, scaffolding and rig, and travel and transportation costs.
The assumption to keep costs equal should be valid in the medium to long term, as there is no reason installations should have substantially different gross cost in Europe since the hardware is identical, system sizes are pretty consistent across countries and labour cost differences for installers are small. At Otovo we have proven this to hold even in Scandinavia, where we observe system costs equal to Germany, despite small installation volumes thanks to a highly digitized sales- and planning process.
In the short term however, we know that price variations occur, both between and within countries. Thus some mature countries, such as the Netherlands, with relatively short distances and a large pool of experienced installation companies, might achieve lower costs which again would push the payback-time down. Similarly, decentralized areas in less mature countries, such as Norway, might experience higher costs which will increase the expected payback time from what outlined here. Still, the analysis gives a good picture of how the payback time differs within areas and across countries.
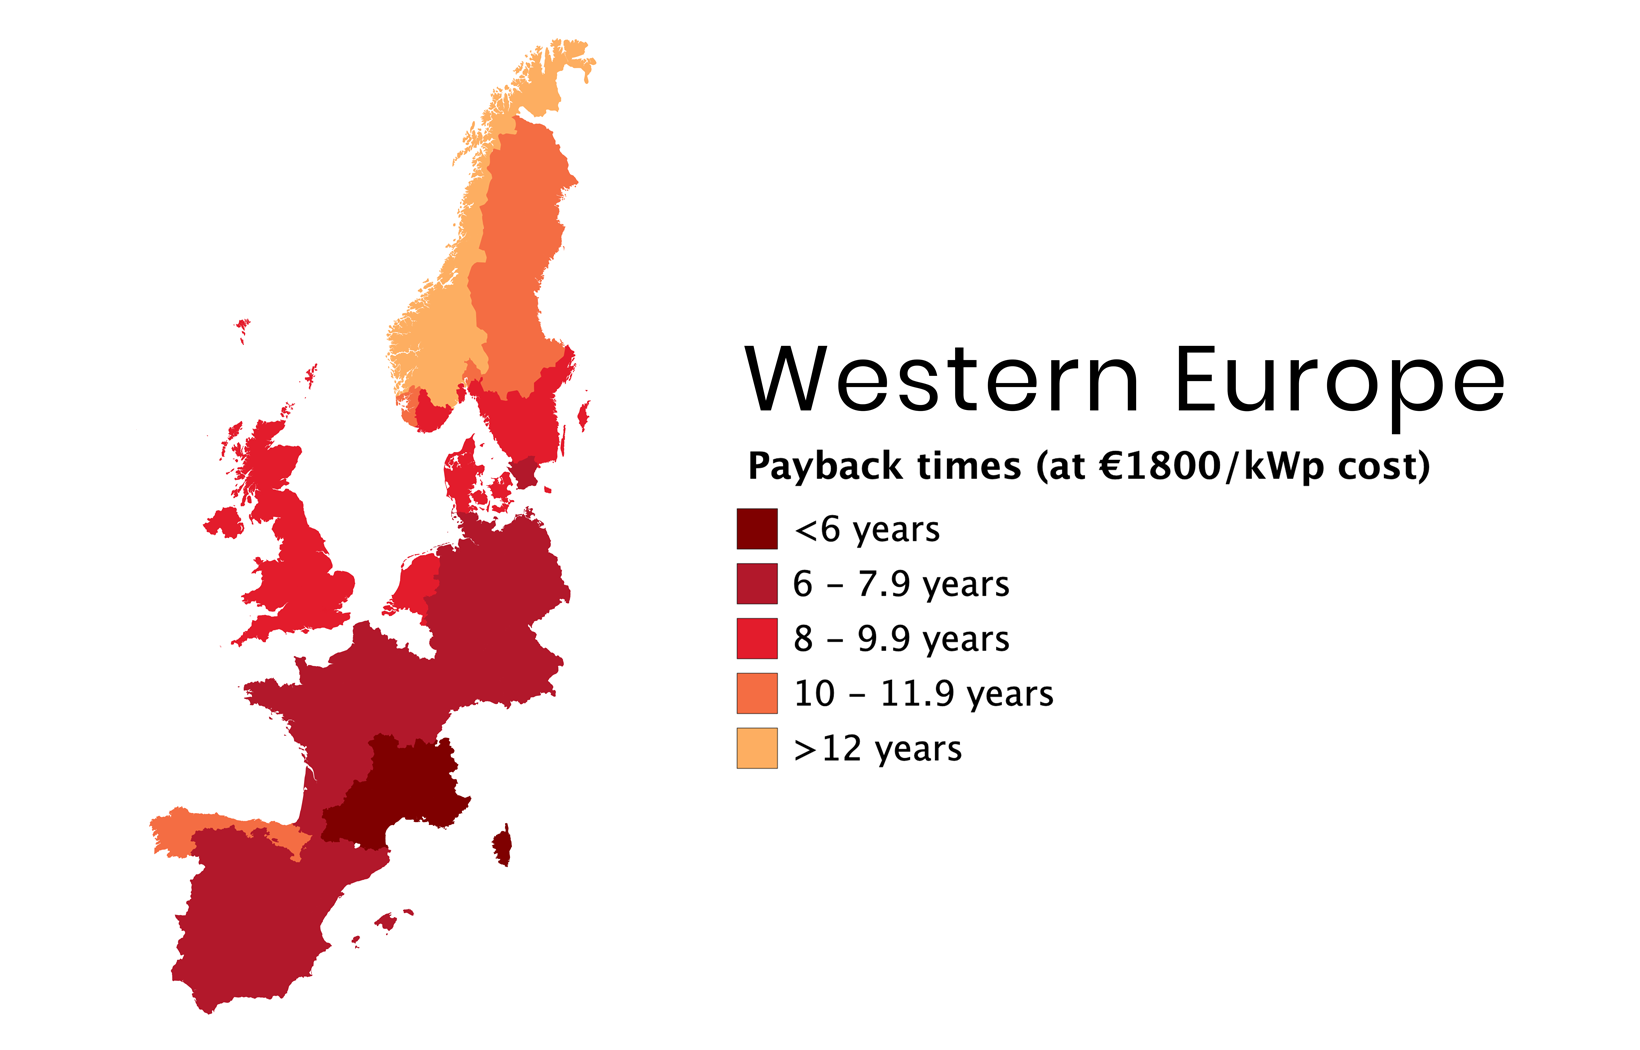
Looking at the overall results, the left chart on the previous page outlines the calculated payback times in the different areas across the selected countries. The payback times varies from less than six years in the southern areas of France, to above 12 years in the northern areas of Norway. In general though, the analysis shows that most of Western Europe sees payback times well below 10 years, and for the countries included from continental Europe, a solar system pay itself back within 8 years or less.
Key highlights and market outlook
Spain
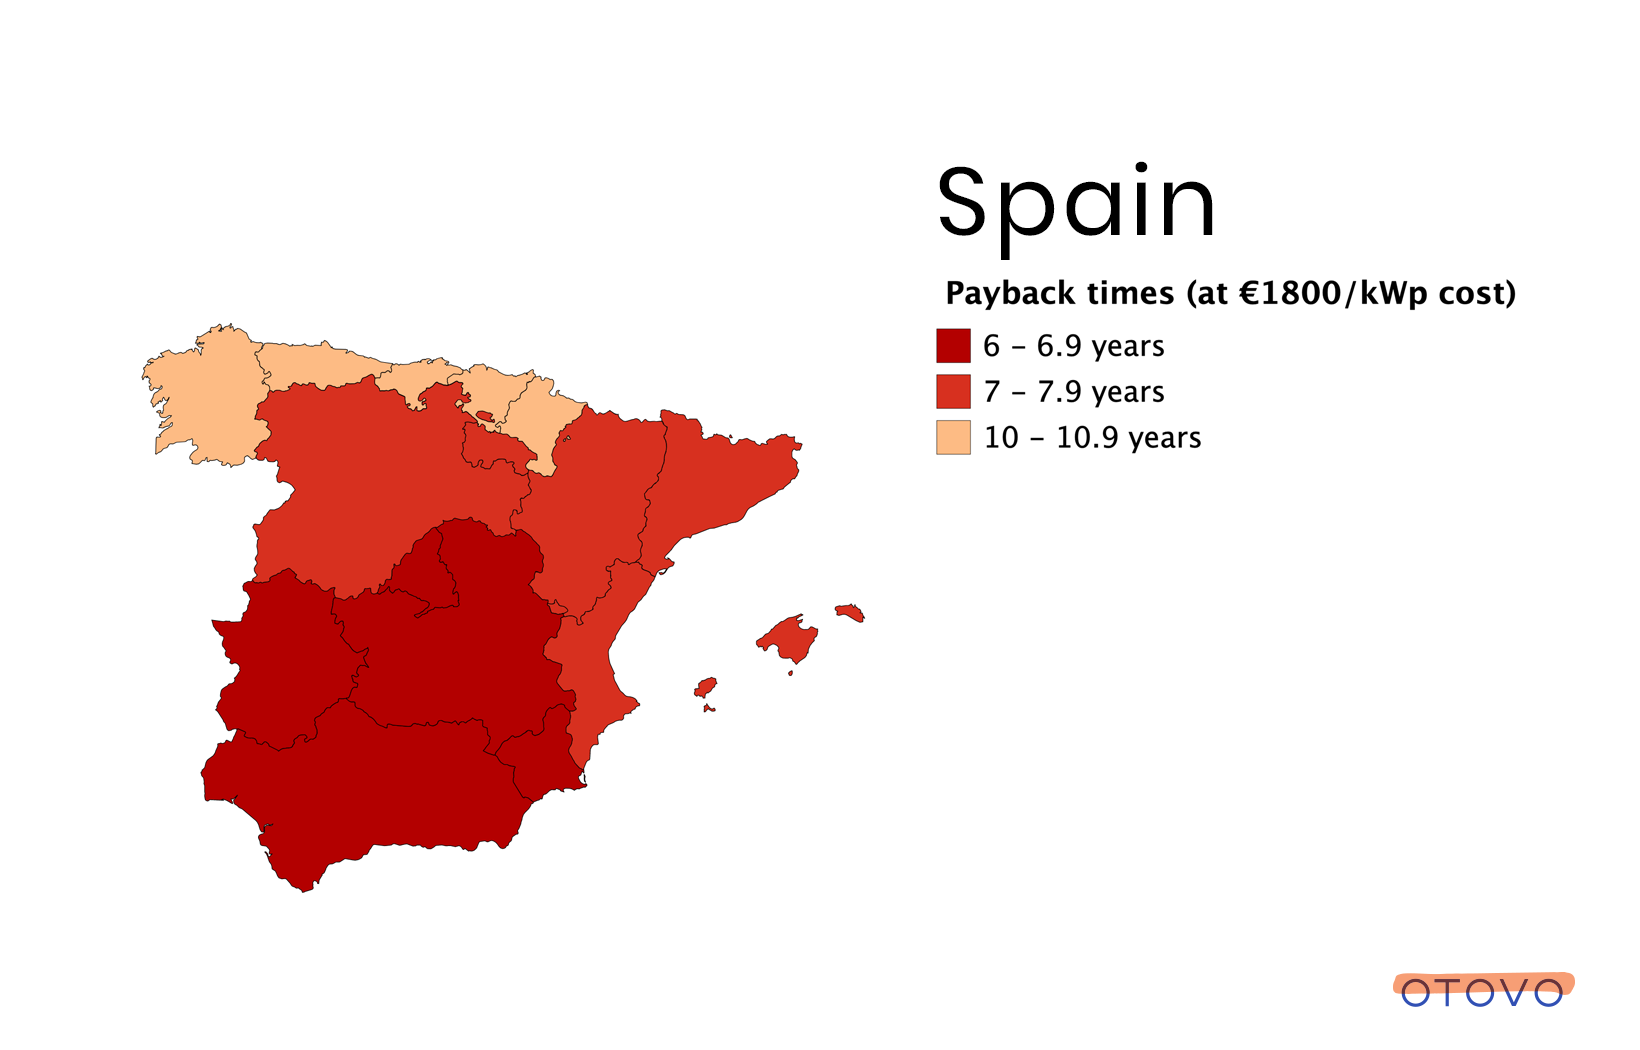
Spain is among the European countries with best meteorological conditions for solar energy. Despite this, it has not managed to follow the European leaders in terms of solar power per inhabitant, mainly due to a harsh regulatory environment with a “solar tax” on self consumed solar energy for grid connected homes.
Despite no subsidy policies, the abundant solar resource in Spain is matched by high electricity prices, which yield short payback times for solar projects. In the southwestern regions comprising Malaga and Seville, the investment is expected to be earned back within 6-7 years. The “solar tax” on homeowners was scrapped in September 2018, and Spain now looks set for a comeback as one of the most attractive market in Europe.
France
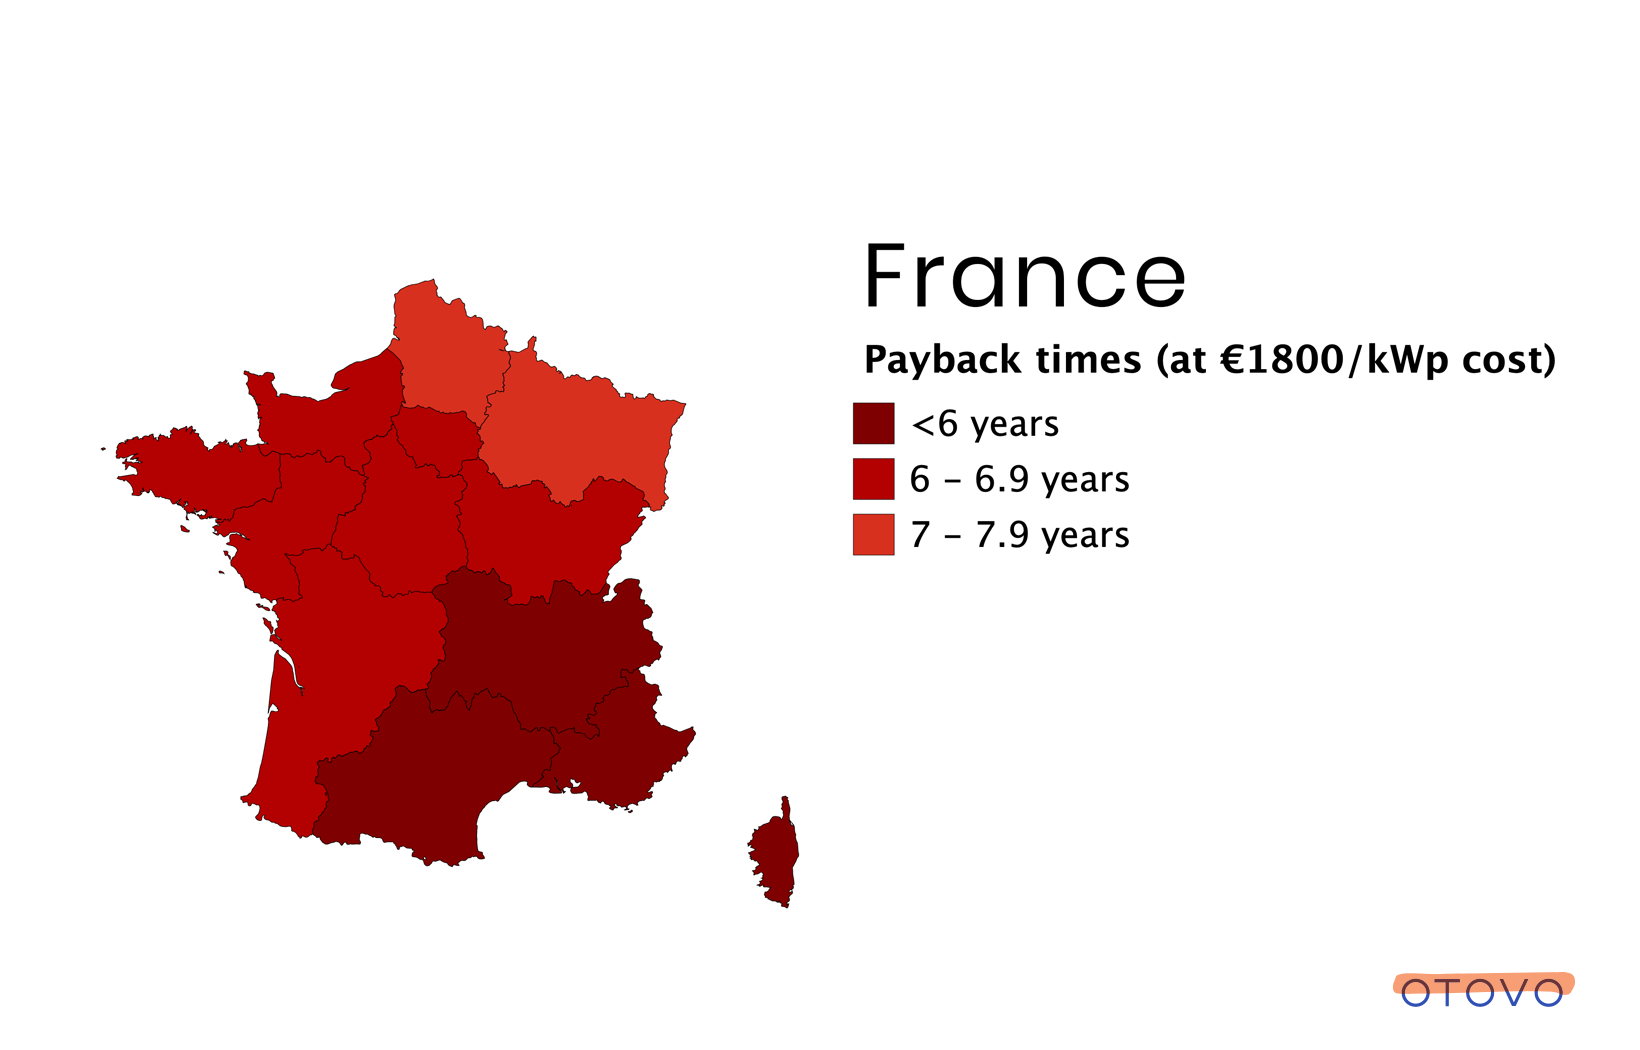
France has traditionally had low energy prices, mostly thanks to nuclear power. Through 2018, the rising CO2 price has been pushing the electricity price upwards. This, in addition to a fairly new subsidy scheme and VAT reduction on systems smaller than 3kWp leads to residential solar payback times coming down all over France.
The solar conditions are overall very good throughout France, with the southeastern Provence Alpes Côte d'Azur region being particularly attractive, thanks to predictably sunny conditions.
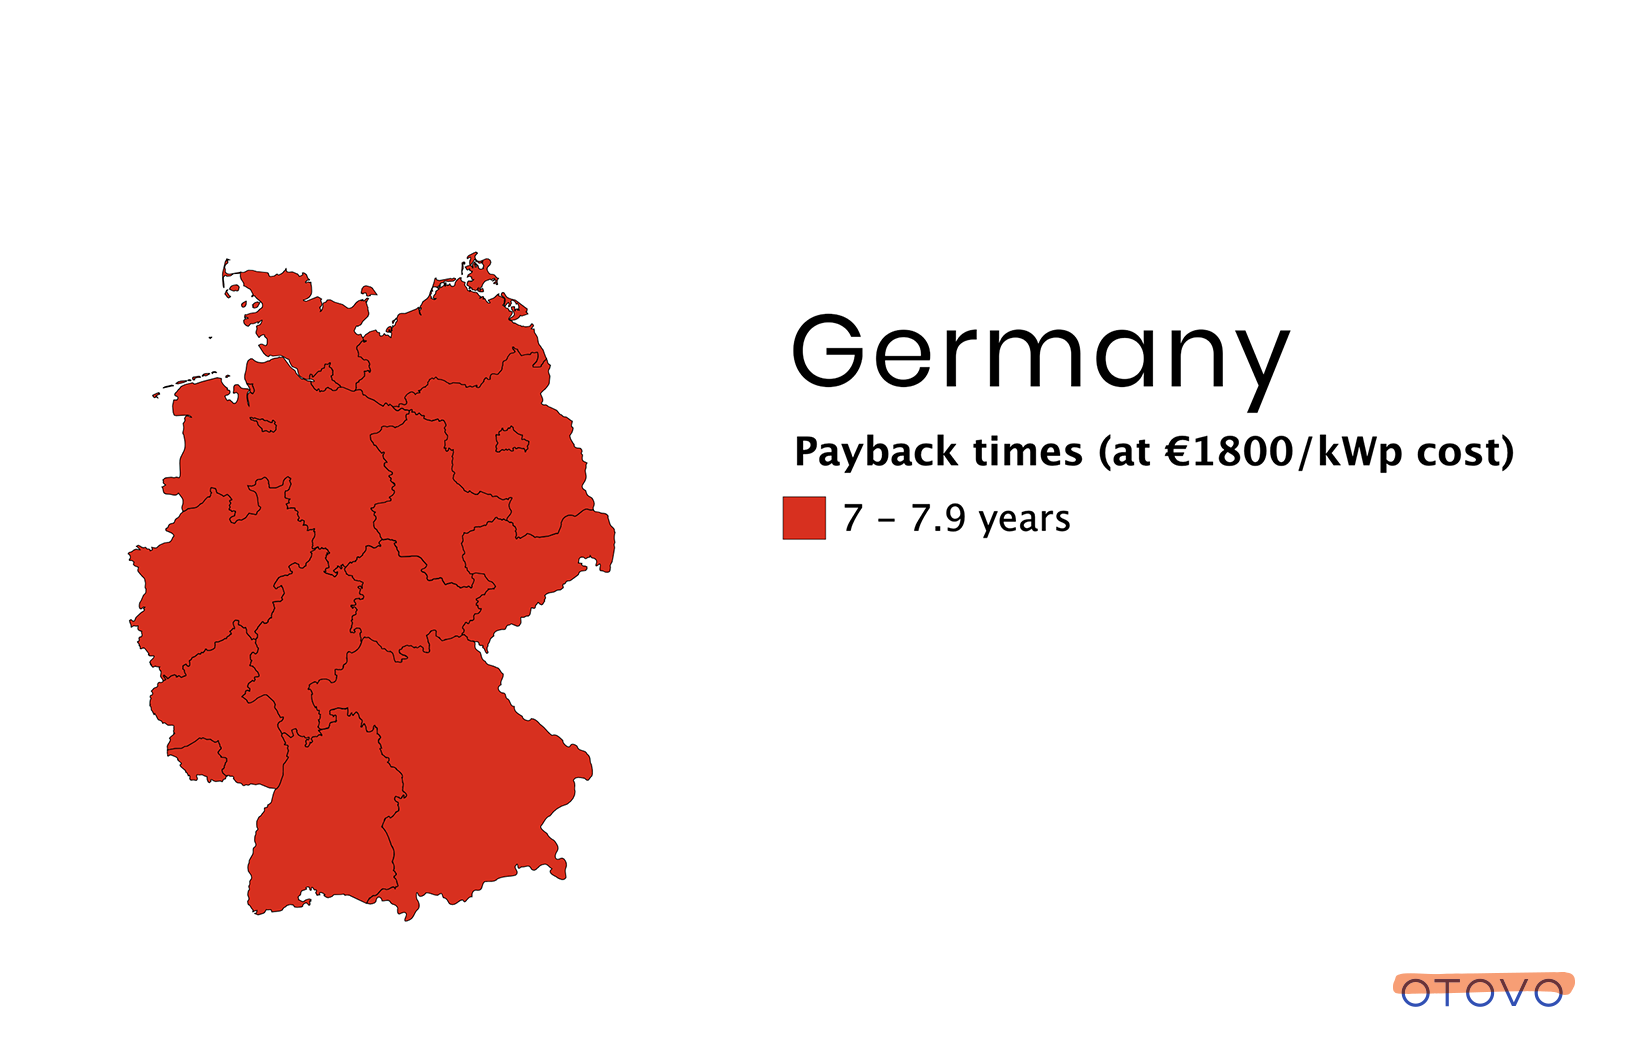
Germany
Germany has been the European solar energy leader so far, with the highest capacity installed.4 The solar conditions is rather similar to Northern France; overall good conditions, with the southern regions of Bavaria and Baden Württemberg being the most attractive.
With expected payback times in the range 7-8 years, Germany is reliably an attractive place to invest in residential solar power, mostly due to its high consumer electricity cost and terms that are still among the best for solar prosumers in Europe.
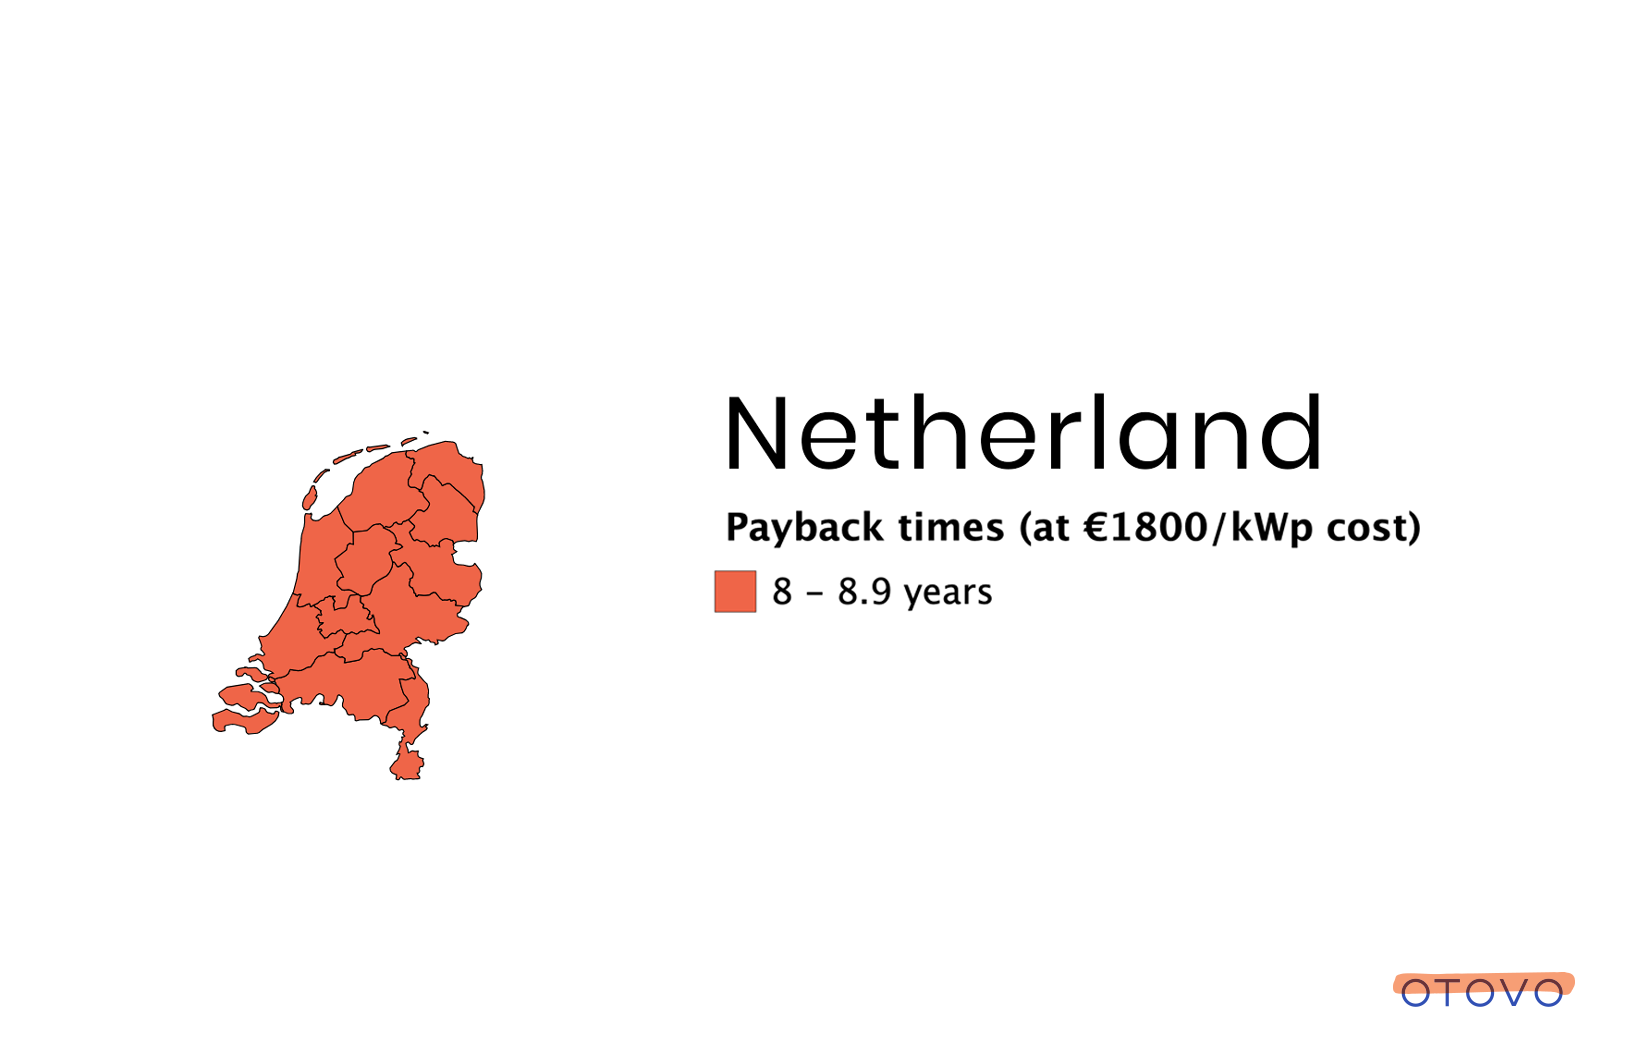
The Netherlands
The Netherlands has experienced a solar boom the last few years, and residential rooftop systems account for a high proportion of the total solar capacity compared to commercial and utility scale systems.
The conditions for solar energy have been good over the last few years - with net metering of surplus energy and investment aid in the shape of reduced value added tax. With cheaper electricity prices compared to its neighbour country Germany, payback times are expected to be somewhat higher, with the most profitable areas being the sunniest, outer parts facing the North Sea.
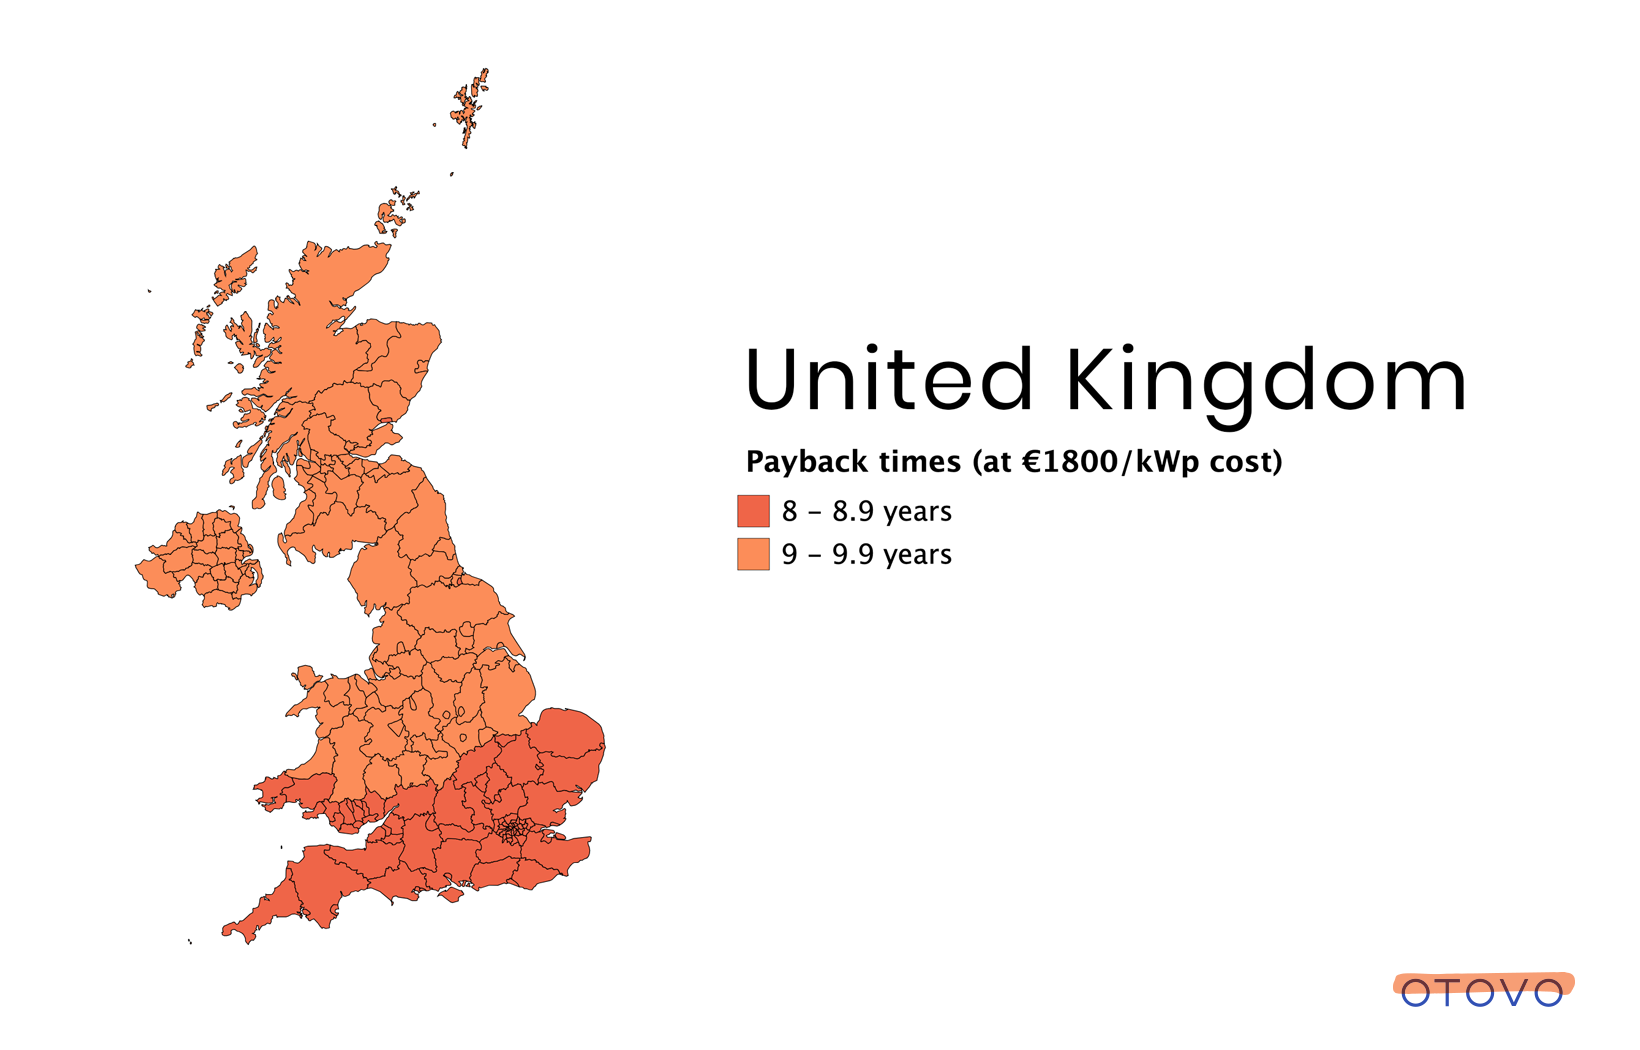
The United Kingdom
With more than 800,000 residential solar systems, the UK is among the European countries with the largest share of installed residential capacity.
Under the current FIT-scheme, the expected payback times are in the range 8-10 years. Note that this analysis is based on the current subsidy conditions, while the government last year announced that new renewable energy installations installed after March 31st 2019 will no longer benefit from the generation and export tariffs. In the new policy regime, payback times are likely to increase to 10-12 years, which is likely to dampen demand.
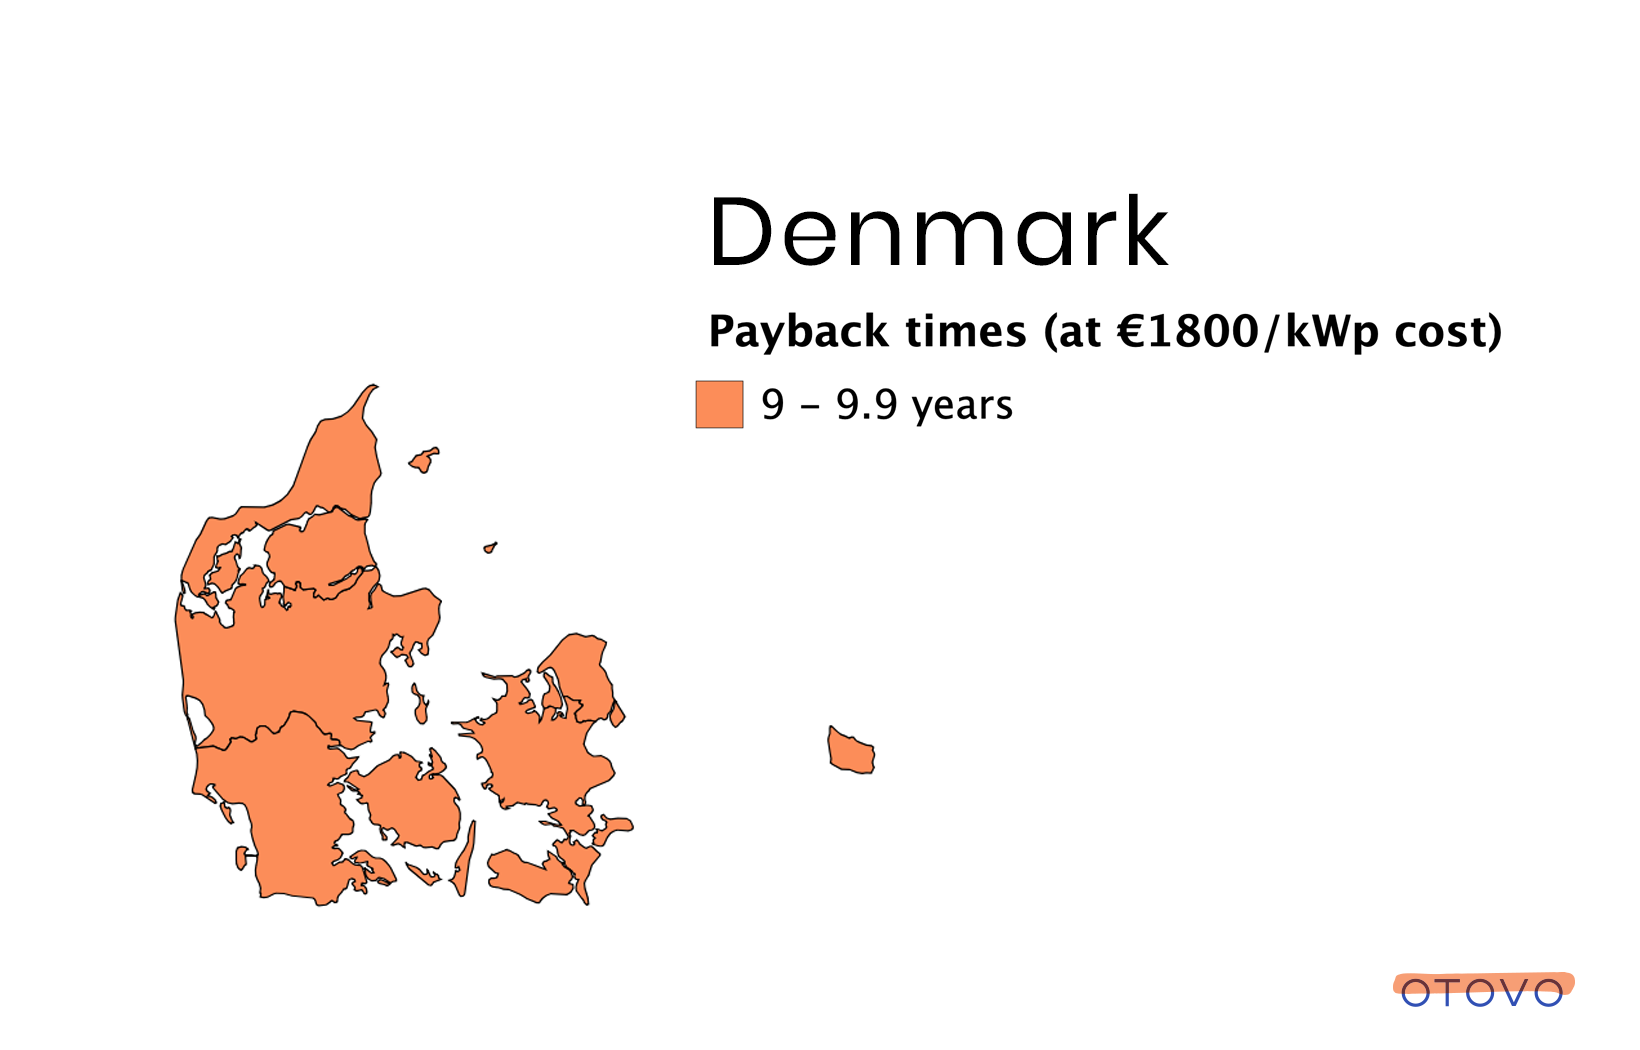
Denmark
Denmark experienced a red-hot residential solar market in 2010-2012. The boom was driven by a net metering policy, later removed to cool off the market. Since then the Danish market has stagnated, waiting for hardware costs to come down enough for residential solar to get back to previous payback times even without subsidies.
This is starting to happen now: Denmark is starting to look increasingly attractive again. Thanks to consistently high consumer electricity prices - among the highest in Europe - the Danes who weren't among the 100.000 who went solar in 2010 and 2011 should start thinking about catching up.
«What we observe in the solar industry the last few years is that when payback times goes below 10 years, the market increase by at least 50%. The good news is that this is starting to become the situation in most of Western Europe. We expect a very strong development in Europe the next few years»
Andreas Thorsheim, CEO Otovo
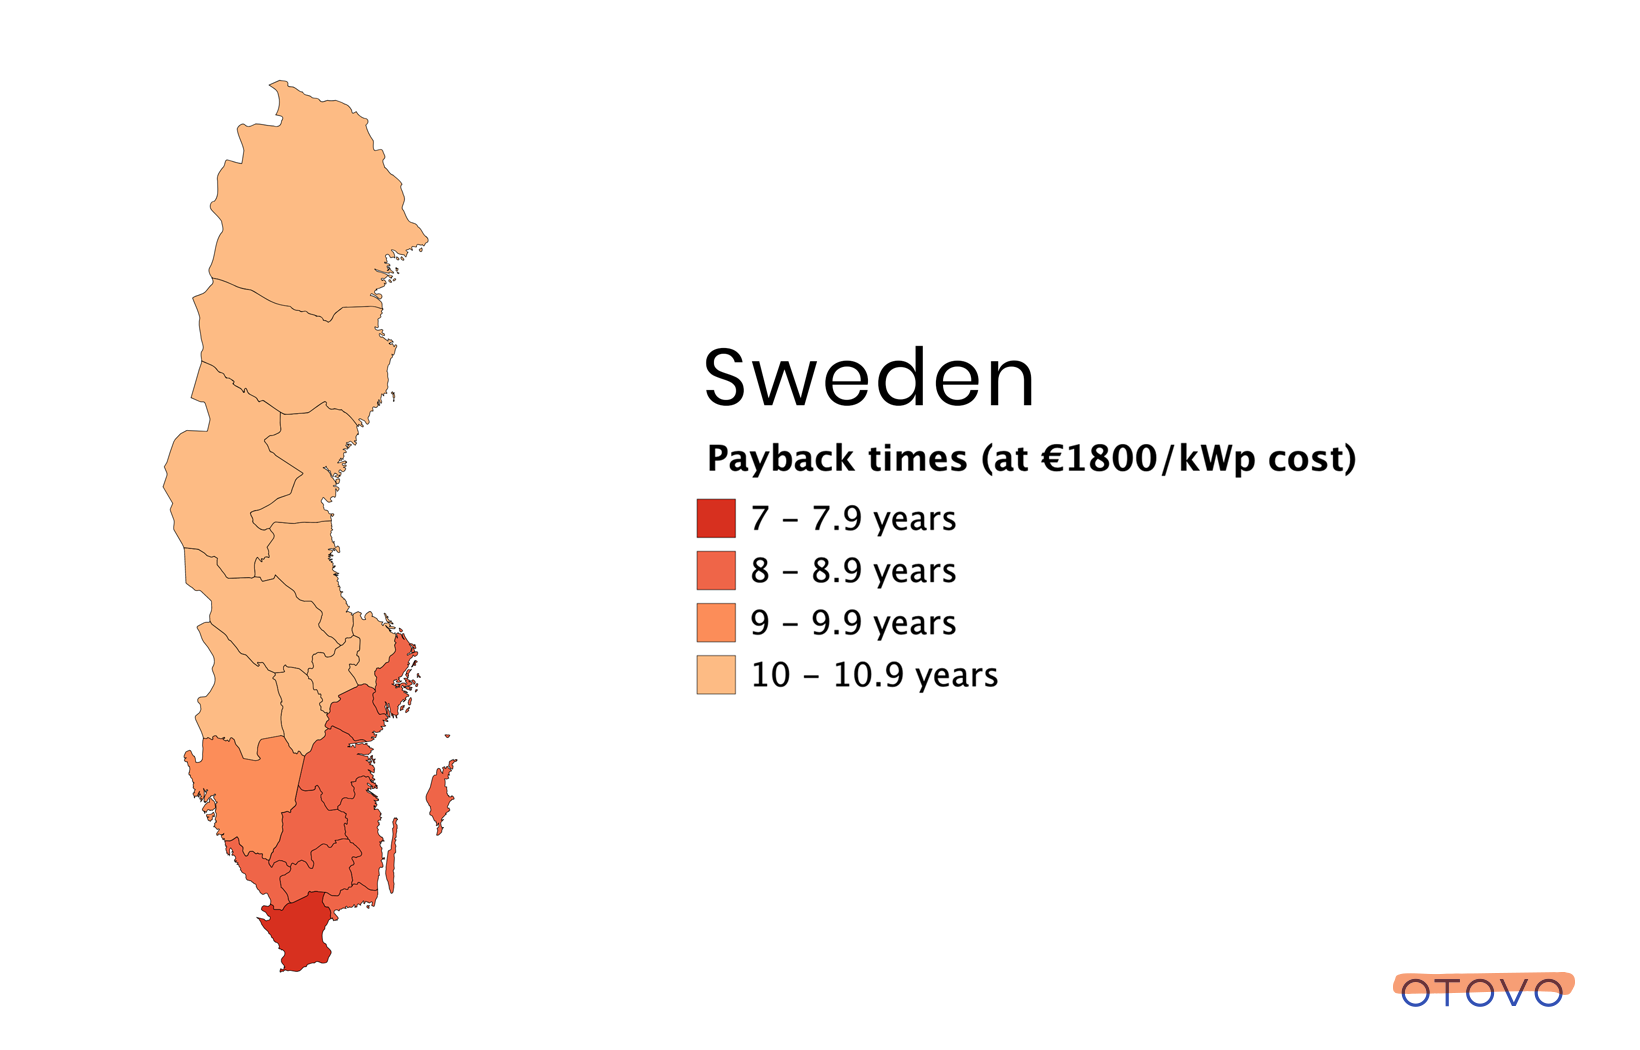
Sweden
Sweden is booming. Over the last four years, the Swedish solar market has increased by 50% annually. Investment subsidies that have been at 30% are now a bit unclear due to the political turmoil. Tax deductions that are not currently under policy consideration amount to 9%, and form a backstop, should the direct subsidy regime change.
Energy prices are up and subsidies are high. Despite its northern latitude, the southern part of Sweden achieve similar payback times to what you see in countries like Spain, France and Germany. The expected payback times are shortest in the populous regions around Malmö in the South, and Stockholm in the South East, but even in Northern Sweden solar energy can be attractive for homeowners.
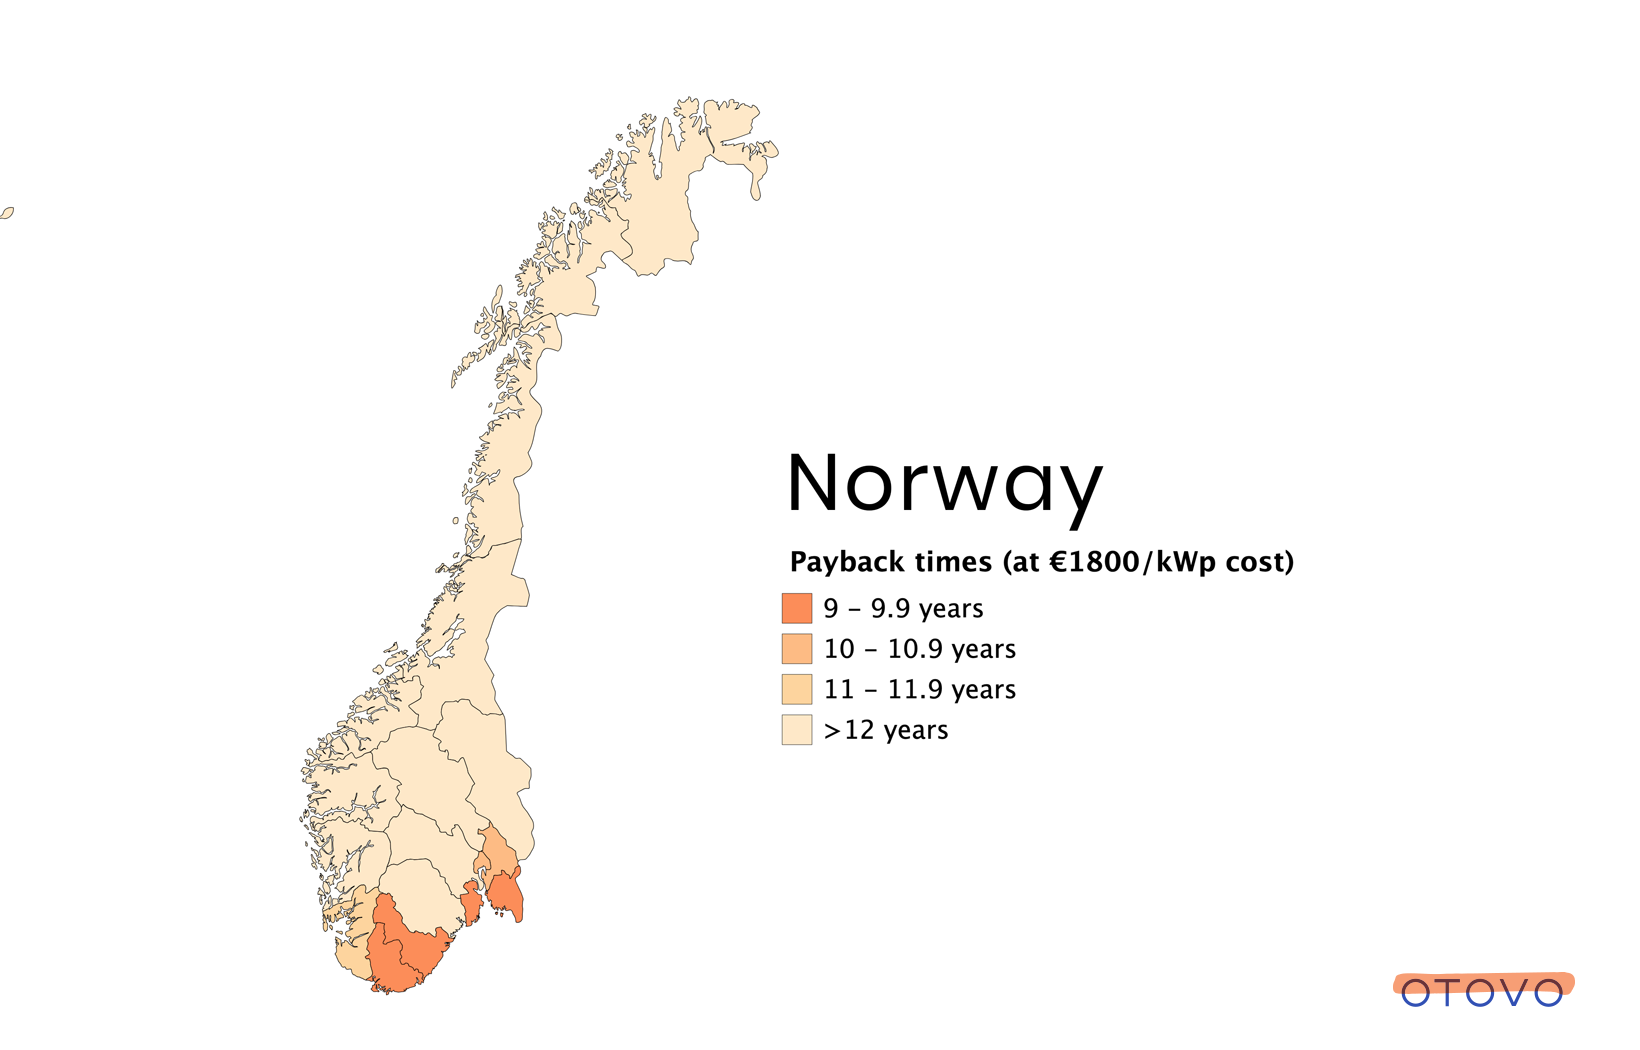
Norway
Norway is perhaps the biggest surprise in this analysis. Just a year ago most of the country had payback times of well above 12 years, depressed by the low hydroelectric electricity prices and poor solar conditions in the West and North. 2018 however has seen electricity prices come up due to a dry first half of the year, increased energy trade with its neighboring countries and higher CO2 prices in Europe.
Also, Norway's subsidies at 1000€ + 125€/kW usually amount to +/- 15% of system cost, contributing to solar becoming feasible even in the Northernmost outpost of the continent.
Sensitivity on self consumption
This analysis assumes a fixed set of factors, equal for all countries, in order to analyse the corresponding payback time in the different countries. One of the main assumption is a system size of 2.9 kWp where 80% of the production is self-consumed. The actual share of production one customer consume varies across different projects, which then will affect the actual payback time in each case. It could also be argued that a self-utilization percentage of 80% might not be realistic in e.g. high electricity consuming countries like Norway and Sweden.
The chart below outlines how sensitive the payback times in different countries are to the share of self-consumption by indicating what the range of payback times would look like if the analysis was to assume that 50% of production was self-consumed, instead of 80%.
As mentioned, the feed-in tariff policies varies across different countries. In the Netherlands, Sweden, and Norway, the feed-in tariffs and electricity prices are relatively equal and the self- consumption share has little impact on the payback times.
With no feed-in-tariffs, Denmark and Spain stands out as the countries were the amount of self-consumption affects expected payback times the most. The calculated payback times increase by as much as 60% in a 50% self-consumption scenario, compared to a 80% scenario.
About this report
The Otovo Solar Insight: Solar Payback Trends 2019, is the first Solar Insight publication by Otovo. The report aims to create an overview of the expected payback times for residential solar in selected European countries, and identify trends in the European residential solar market.
The analysis assumes a system size of 2.9 kWp where 80% of the production is self-consumed. The payback calculations are done by dividing the full investment cost of the solar panels by their yearly output in energy multiplied by the cost of electricity (80%) and feed-in tariffs (20%). This gives the number of years needed to pay back the cost of the system assuming no time preference for money or discounting of future cash flows, and does not take into account changes in electricity prices in the payback period. This method was chosen because it is preferred by consumers over IRR calculations or other more stringent methods. Even if not accounting for a change in the energy price and disregarding cost of capital represents a weakness, payback times have become a heuristic that many homeowners and investors use.
The solar payback times outlined in this publication are based on solar resources as found in the European Commission’s Joint Research Centre’s Photovoltaic Geographical Information System PV GIS, electricity prices for household consumers (first half of 2018 average, 5-15 MWh) as reported in Eurostat, as well as subsidies, taxes and feed-in tariff regimes in the selected European markets.
Insulation used in the calculations is based on south facing roofs with a slope of 35 degrees. Roofs with other azimuth angles and slopes are likely to have somewhat longer payback times.
The report is based on current conditions, and does not take into account planned future changes to a country’s subsidy scheme.
For simplicity the total cost of systems are kept equal in all countries at €1800/kWp (incl. VAT, pre subsidies).
All maps in this report are created using mapchart.net.
About Otovo
Otovo was founded in 2016 by former executives from the software, consumer retail and renewable energy industries.
Otovo enables homeowners to get tailor made, instant quotes for solar panels on their roofs, while hosting a marketplace with hundreds of installers who algorithmically bid for the projects generated. The Norway-based distributed energy sales and installer platform currently covers Norway, Sweden and France, with plans for future expansion to more European countries.
Contact information
For further enquiries please contact:
Andreas Thorsheim, CEO, athornor@otovo.com
Gina Nygard, Business Developer, ginany@otovo.com
---
Oslo, February 2019
Sources
https://ec.europa.eu/eurostat/statistics-explained/index.php?title=Electricity_price_statistics
https://www.edfenr.com/actualites/prime-encourage-autoconsommation/
http://www.photovoltaique.info/Fiscalite.html
http://www.photovoltaique.info/Aujourd-hui-arrete-du-9-mai-2017.html?var_mode=calcu
https://www.bmwi.de/Navigation/EN/Home/home.html,
https://www.consuwijzer.nl/energie/duurzame-energie/teruglevering/wat-is-salderen
https://www.ofgem.gov.uk/environmental-programmes/fit/fit-tariff-rates
https://www.enova.no/privat/alle-energitiltak/solenergi/el-produksjon-/
NOK/EUR = 0.104
4. http://www.solarpowereurope.org/wp-content/uploads/2018/09/Global-Market-Outlook-2018-2022.pdf